
Turtle Graphics with CoCalc
There are several ways to use turtle graphics with CoCalc.
Sage worksheet with Turtle module
Here is a Sage worksheet on the CoCalc share server using Turtle. In the Sage worksheet, code and turtle graphics output are visible in the same tab.
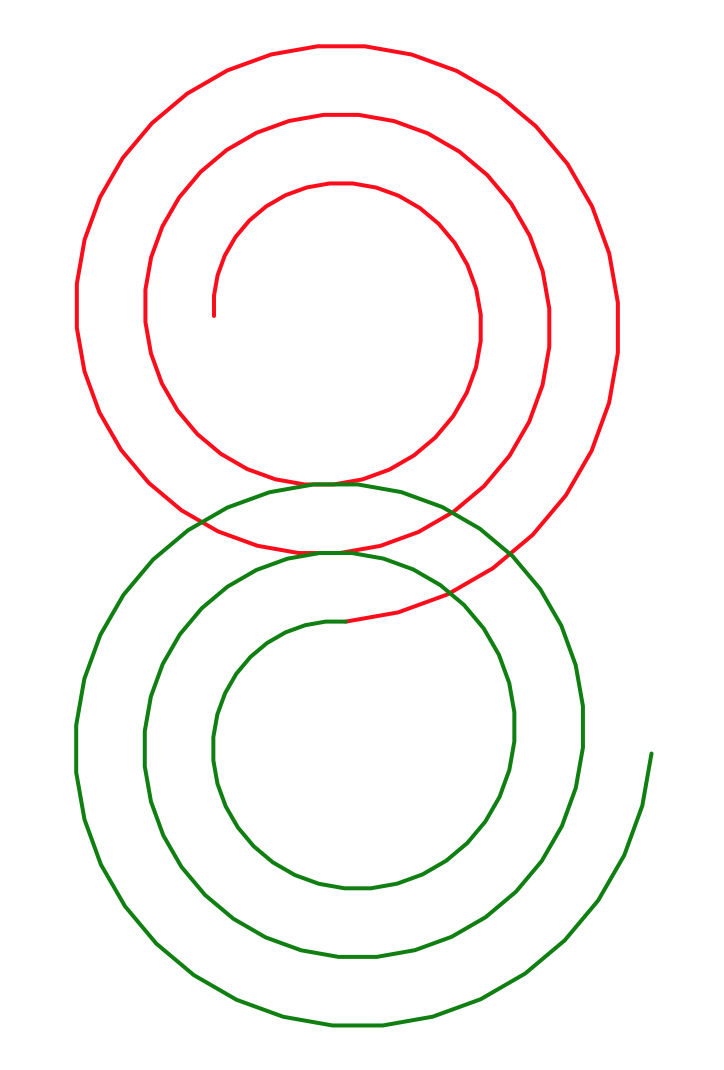
Turtle spirals in the example Sage worksheet
To copy the example into a project of your own, do the following:
Sign into CoCalc.
While signed in, open another browser tab in the same browser session and navigate to the share link above. After a moment, you will see the published read-only copy of the worksheet.
Click
Open in CoCalcat the upper right. A third browser tab will open.Click
Filesat upper left in this latest tab. You will see a Files listing with a line for the Turtle example.Click the
Copybutton at the left of the Turtle entry. You can now copy the worksheet to a destination project and folder of your own.
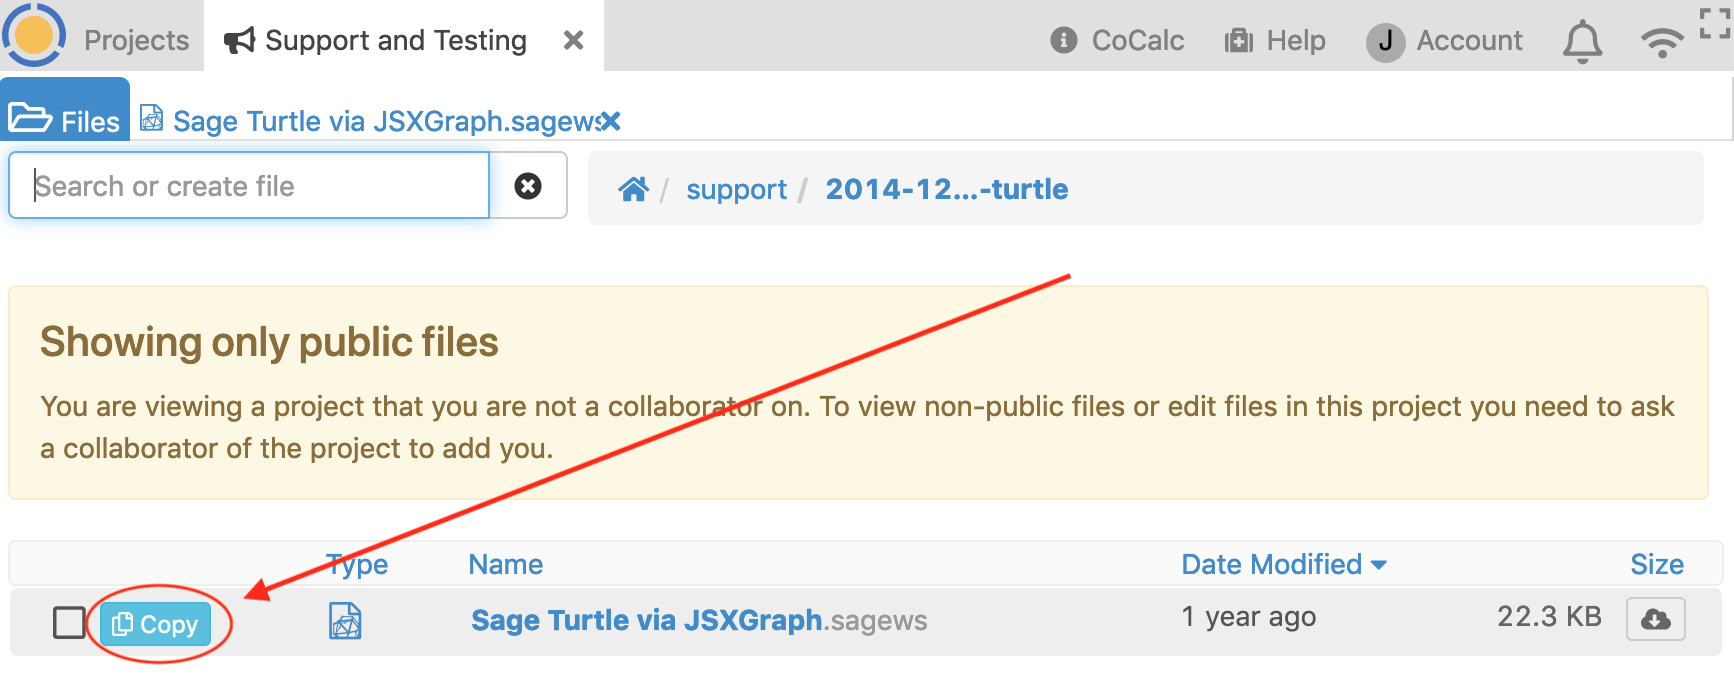
copying worksheet from share server to personal project
Note
The remaining methods use the Python turtle library. This library relies on tkinter. You can use tkinter in CoCalc only from the the X11 Desktop. Code for the examples below is taken from the Turtle star on the doc page for the Python turtle library.
X11 terminal with Jupyter notebook
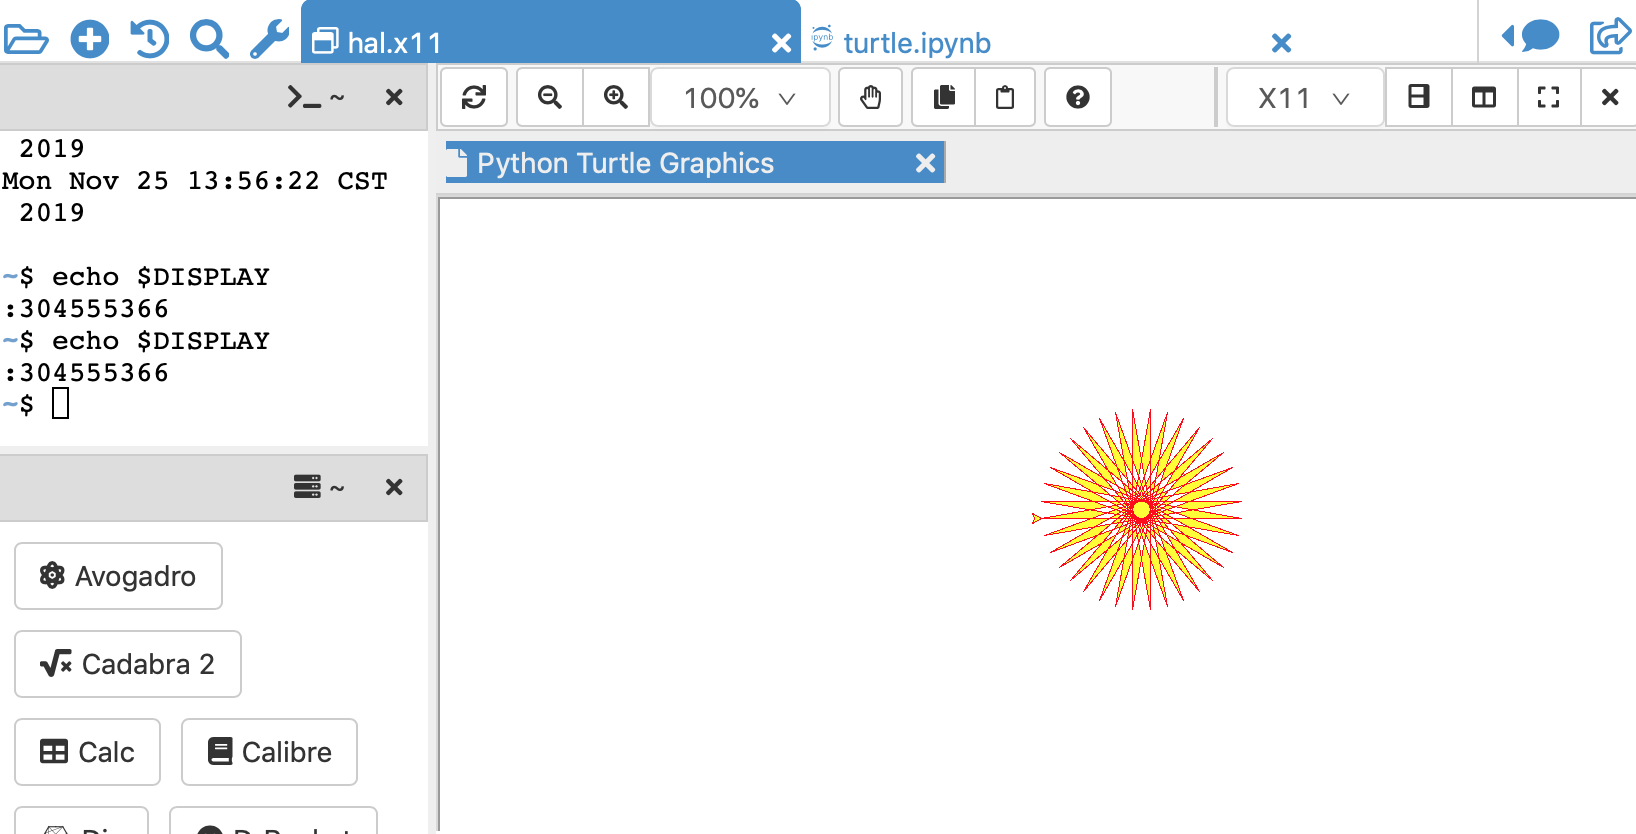
python turtle display created by jupyter notebook in a second tab
In the x11 terminal, echo the DISPLAY environment variable to get the display number:
~$ echo $DISPLAY
:581076966
In your Jupyter notebook set DISPLAY to the same number:
import os
os.environ['DISPLAY'] = ":581076966"
Turtle graphics work in the Jupyter notebook, but appear in the X11 desktop. You may have to run the graphics cell twice to see the turtle graphics.
X11 Desktop on a Compute Server
This is similar to the above, but you run X11 Desktop on a Compute Server, where you have to install python3-tk, for example by putting !sudo apt install -y python3-tk into a cell in your Jupyter notebook (which has to run on the same compute server, of course):
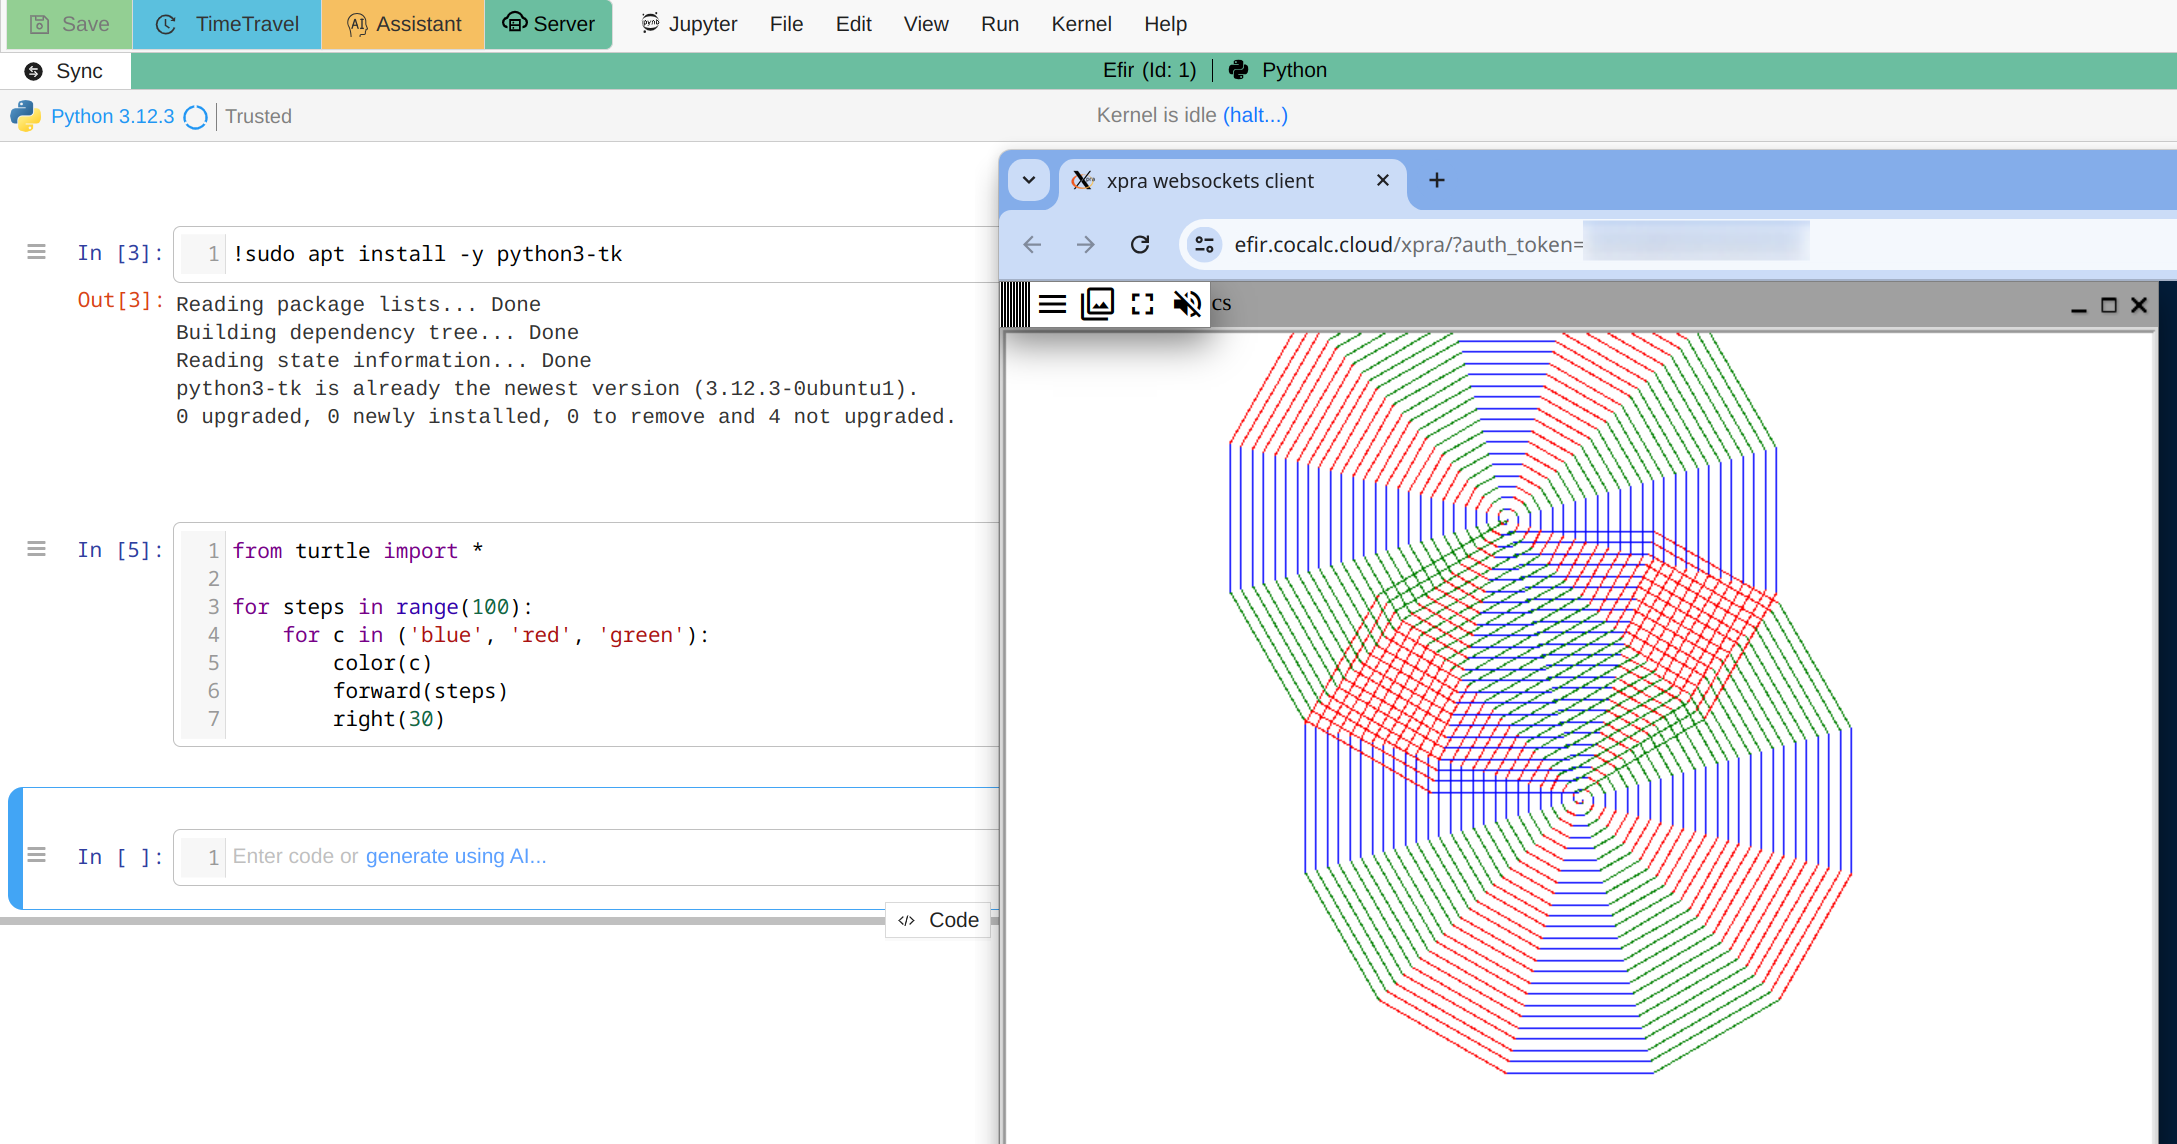
Turtle Graphics on a Compute Server
X11 terminal with nteract
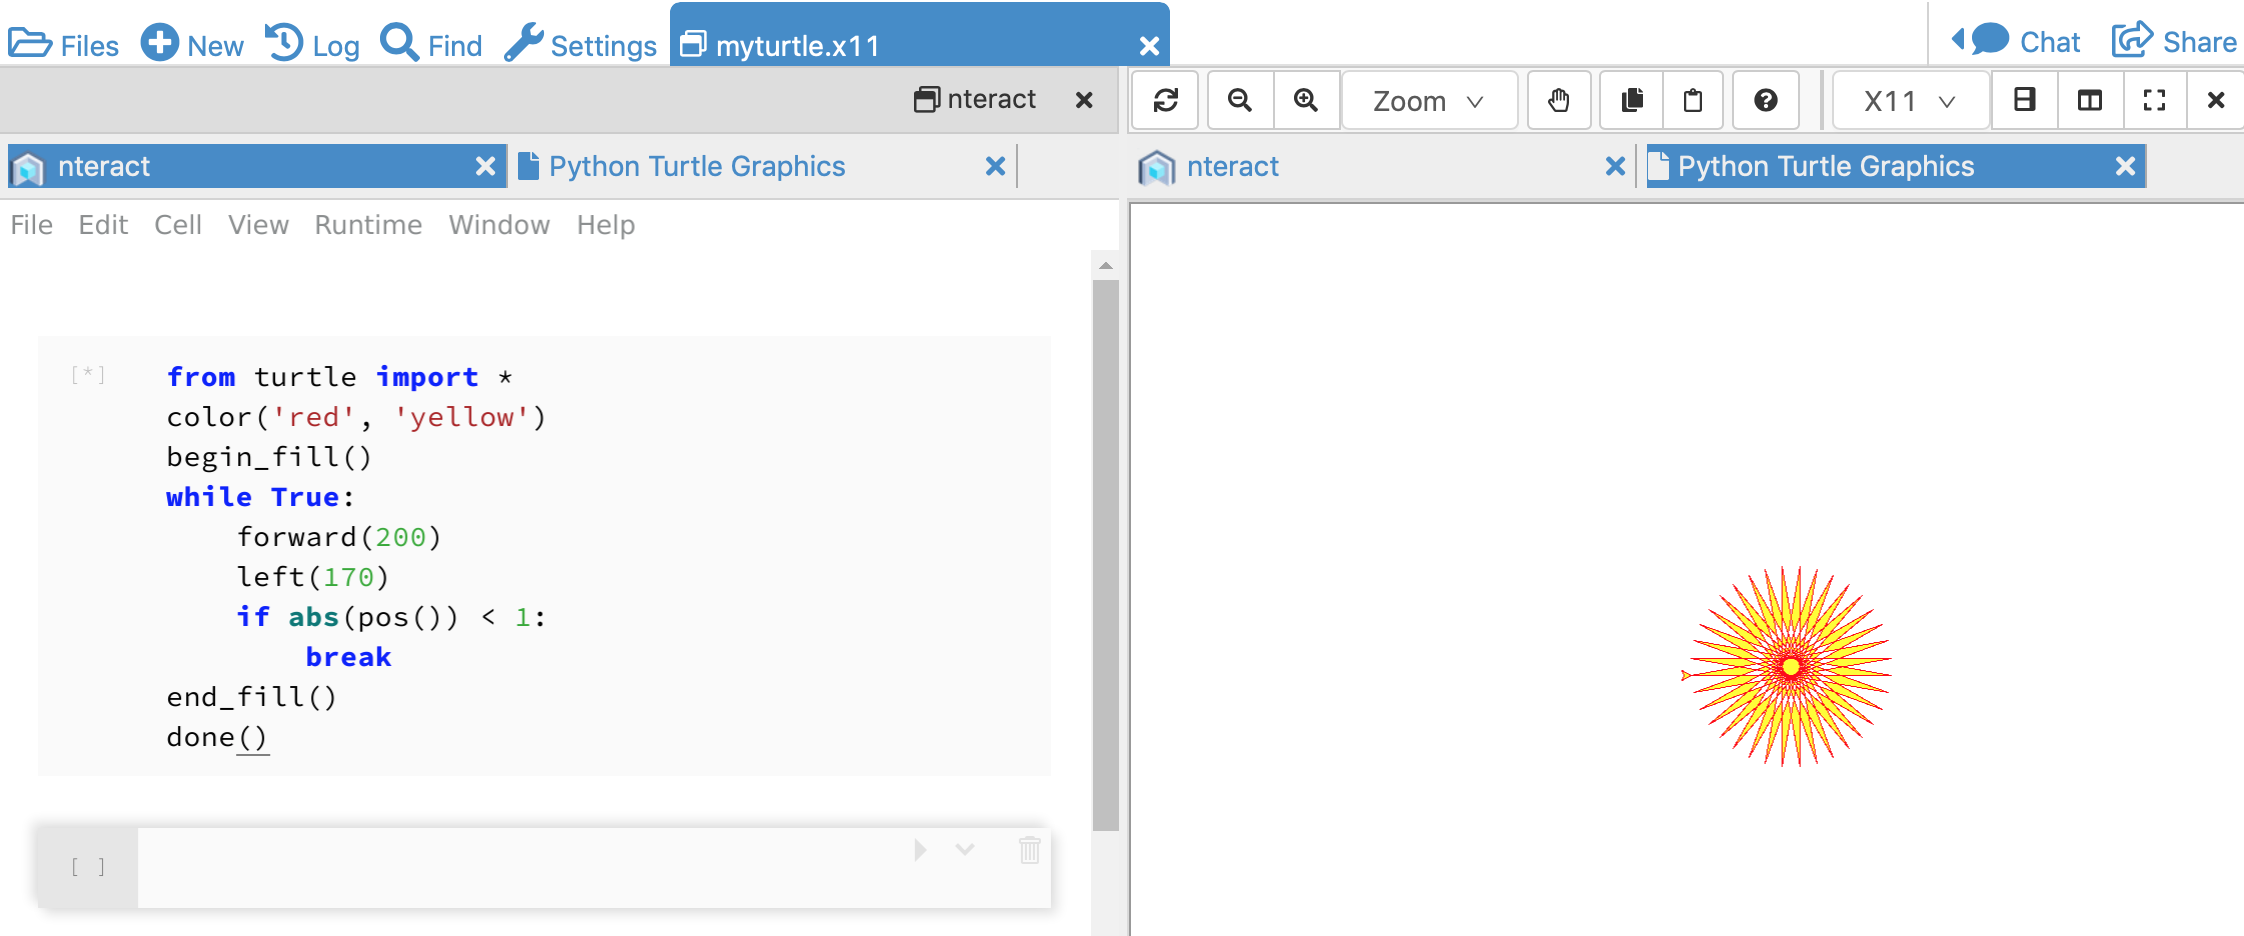
nteract python turtle display
This approach uses the enteract desktop application with X11.
Open an X11 Desktop.
Click the
nteractbutton at the bottom, or type “nteract” at the shell prompt. Wait for nteract to start. This can take up to a minute the first time you run it in CoCalc X11.Paste this code and hit shift enter:
from turtle import *
color('red', 'yellow')
begin_fill()
while True:
    forward(200)
    left(170)
    if abs(pos()) < 1:
        break
end_fill()
done()
A new tab with title “Python Turtle Graphics” will appear in the X11 display when you run the code. It may not look right the first time. If that happens, return to the compute cell in the nteract tab and run the code again. You can click the vertical split button (upper right) and see the Jupyter notebook and graphics side-by-side, as shown in the screenshot.