Manage Running Processes
This page documents several operating system commands for process management. CoCalc provides a convenient summary with the Processes panel.
See all Processes
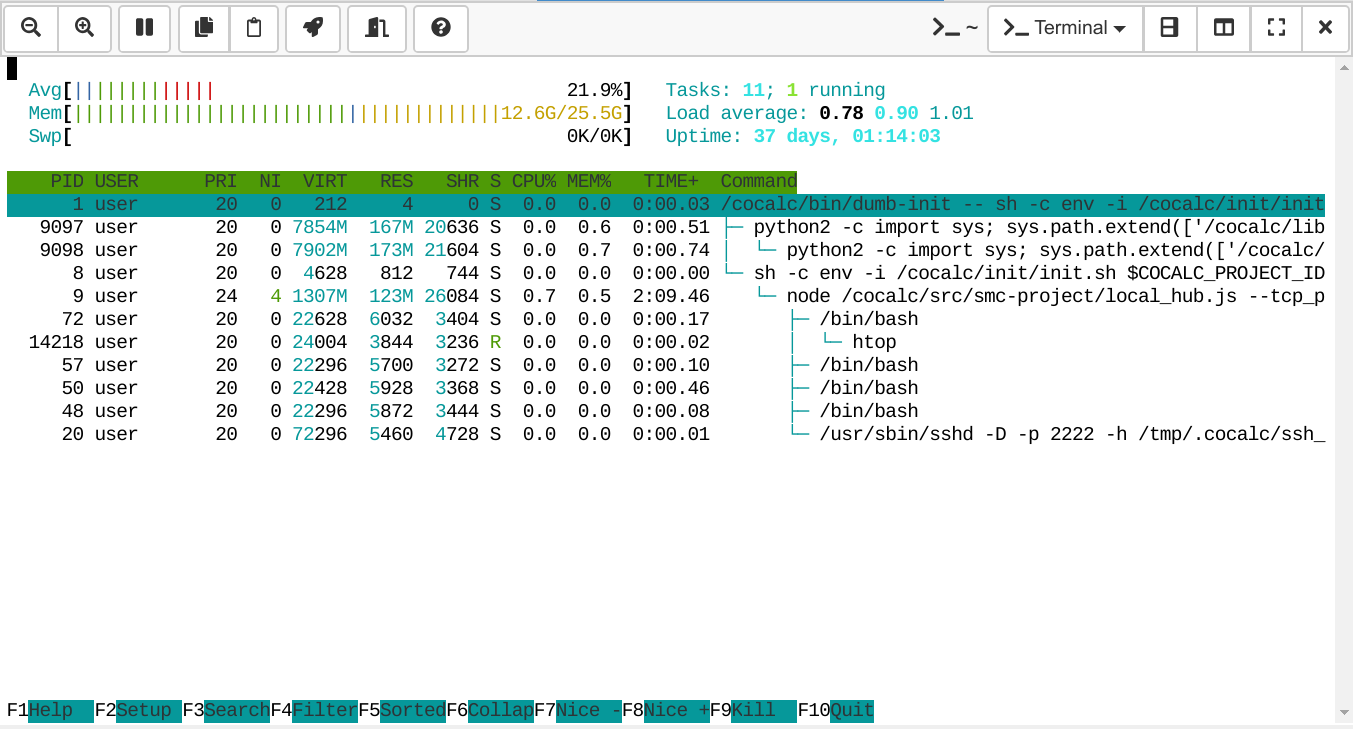
Type exactly the following in a Linux Terminal (+New → Terminal) to see all processes running in a project:
htop
The header informs you about overall utilization of the node,
each row (you can scroll via your cursor keys) lists a process and use your F5 key
to toggle between a tree or a sorted list.
The column RES tells you the residual memory usage (what’s really being used, more or less),
and the CPU% column the computational use of one CPU core.
The TIME+ column tells you the aboslute time that process has used the CPU.
Select one or more processes via the space key of your keyboard. Via the F9 key you can terminate or kill a process, etc.
If supported, mouse-clicks should also work.
See htop manpage for more information
or click the letter h for help after starting it up; and q to quit the application.

See Memory Utilization
Type exactly the following in a Linux Terminal (+New → Terminal):
smem -tk
It lists all processes and the bottom line shows the total sum.
The last RSS column is probably the most interesting one, for more consult man smem. The total used memory is also listed under “Project usage and quotas” in Project Settings (based on Linux’ cgroup management).
~$ smem -tk
  PID User     Command                         Swap      USS      PSS      RSS
    1 user     /cocalc/bin/dumb-init -- sh        0    16.0K    19.0K    72.0K
   12 user     sh -c env -i /cocalc/init/i        0    88.0K   136.0K     1.7M
   24 user     /usr/sbin/sshd -D -p 2222 -        0   756.0K     1.1M     6.3M
   58 user     /bin/bash                          0     2.4M     2.5M     5.8M
   52 user     /bin/bash                          0     2.4M     2.5M     5.8M
   54 user     /bin/bash                          0     2.4M     2.5M     5.8M
 1397 user     /usr/bin/python /usr/bin/sm        0     8.2M     8.3M    10.6M
   13 user     node /cocalc/src/smc-projec        0    89.2M    91.6M   114.6M
-------------------------------------------------------------------------------
    8 1                                           0   105.4M   108.6M   150.7M
Even more utilities
Besides htop and smem, there are many more system utilities installed.
Given a project runs in a Docker environment, you only see a limited view of all what’s going on, but it might still be interesting for you.
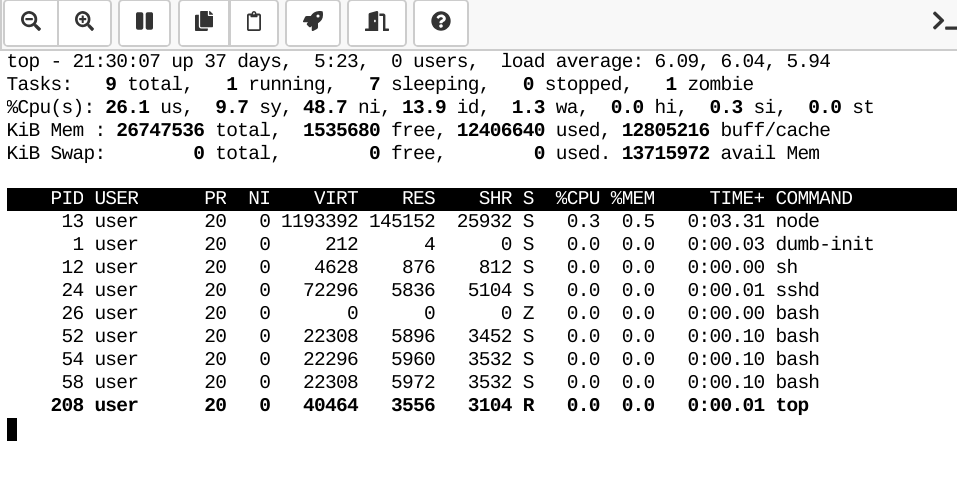
top
The “classic” version htop, similar layout.
Press key h for help after starting it; and q to quit the application.

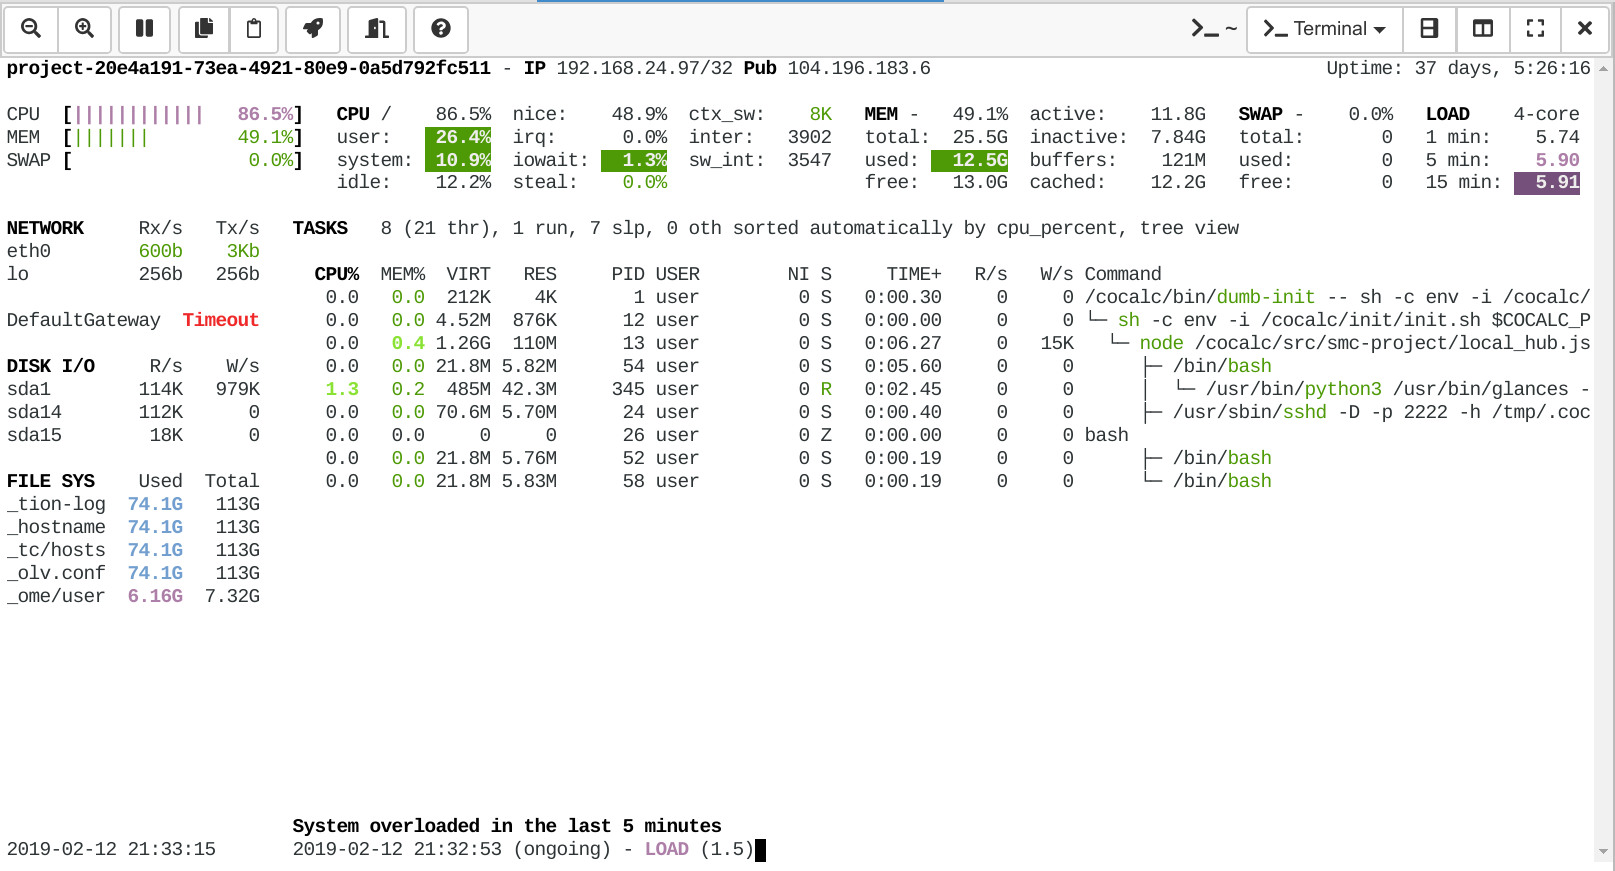
glances
Glances is a modern Python-based monitoring utility. Start it the following way if you’re using a white terminal background and want to enable a tree-view of your processes:
glances --theme-white --tree
Again, press key h for more help and q to quit.
You can see more command-line switches via glances --help.

ps aux
An all-time classic is ps aux. Run man ps to learn more about that utility.
~$ ps aux
USER         PID %CPU %MEM    VSZ   RSS TTY      STAT START   TIME COMMAND
user           1  0.0  0.0    212     4 ?        Ss   21:29   0:00 /cocalc/bin/dumb-init -- sh -c env -i /cocalc/init/init.sh $COCALC_PROJECT_ID
user          12  0.0  0.0   4628   876 ?        Ss   21:29   0:00 sh -c env -i /cocalc/init/init.sh $COCALC_PROJECT_ID
user          13  1.4  0.4 1324640 115924 ?      Rl   21:29   0:06 node /cocalc/src/smc-project/local_hub.js --tcp_port 6000 --raw_port 6001 --k
user          24  0.0  0.0  72296  5836 ?        S    21:29   0:00 /usr/sbin/sshd -D -p 2222 -h /tmp/.cocalc/ssh_host_rsa_key -o PidFile=/tmp/.c
user          26  0.0  0.0      0     0 ?        Z    21:29   0:00 [bash] <defunct>
user          52  0.0  0.0  22308  5896 pts/0    Ss+  21:29   0:00 /bin/bash
user          54  0.0  0.0  22296  5960 pts/1    Ss   21:29   0:00 /bin/bash
user          58  0.0  0.0  22308  5972 pts/2    Ss+  21:29   0:00 /bin/bash
user         631  0.0  0.0  36148  3212 pts/1    R+   21:37   0:00 ps aux
