Dash
This is based on simple example how to run dash by plot.ly in CoCalc. This is taken from the dash introduction. A lot more sophisticated dashboards with interactive sliders, selection boxes, and linked plots are possible!
Note
The main modification is telling Plot.ly to listen on 0.0.0.0 and to
compose the URL based on the domain name, the project ID and the port number!
Access to this endpoint is only allowed for authenticated collaborators on that project!
Create a file named
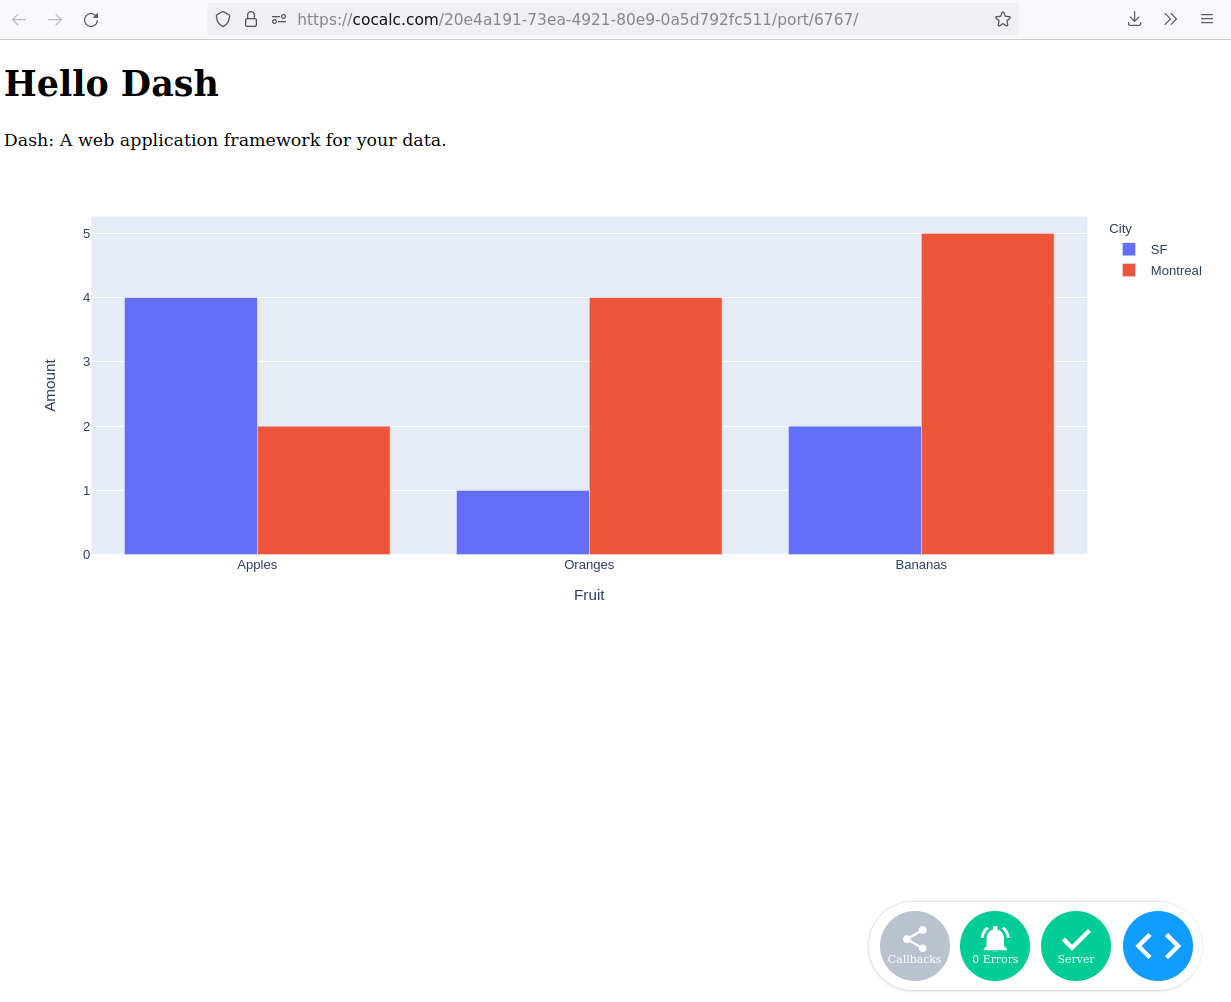
dash_01.py:import os import dash import dash_core_components as dcc import dash_html_components as html import plotly.express as px import pandas as pd # the next 4 lines are CoCalc specific port = 6767 project_id = os.environ['COCALC_PROJECT_ID'] base_url = f'/{project_id}/port/{port}/' dash_app = dash.Dash(name=__name__, url_base_pathname=base_url) # assume you have a "long-form" data frame # see https://plotly.com/python/px-arguments/ for more options df = pd.DataFrame({ "Fruit": ["Apples", "Oranges", "Bananas", "Apples", "Oranges", "Bananas"], "Amount": [4, 1, 2, 2, 4, 5], "City": ["SF", "SF", "SF", "Montreal", "Montreal", "Montreal"] }) fig = px.bar(df, x="Fruit", y="Amount", color="City", barmode="group") dash_app.layout = html.Div(children=[ html.H1(children='Hello Dash'), html.Div(children=''' Dash: A web application framework for your data. '''), dcc.Graph(id='example-graph', figure=fig) ]) if __name__ == '__main__': print(f'Open this link to access Dash.') print( f'You might have to refresh once or twice in case it takes time to load!\n\n' ) print(f' https://cocalc.com{base_url}\n\n') dash_app.run_server(debug=True, port=port, host='0.0.0.0')
in a Linux Terminal run:
python3 dash_01.py
After 5-10 seconds of startup time, the interactive plot is accessible at the following URL:
https://cocalc.com/[PROJECT_ID]/port/6767/
Note
Initially, you might have to wait a few seconds until it shows up or refresh the page once to get the plot.ly server fully started and the page properly loaded!
This is how the dashboard looks like: